Prerequisite:
You will need to have applied the charting hotfix (find it here) to your CF7 installation.
Using scaling is a breeze in CF7 after you have installed the above given hotfix. The idea behing "scaleTo" and "scaleFrom" attributes is to specify the y-axis range of your charts. I will illustrate this by plotting five points: 1, 25, 50, 75, 99 on a line graph. This chart can be plotted by the following code:
<cfchart format="png" scalefrom="0" scaleTo="100" gridlines="5">
            <cfchartseries type="line">
                        <cfchartdata item="Point1" value="1">
                        <cfchartdata item="Point2" value="25">
                        <cfchartdata item="Point3" value="50">
                        <cfchartdata item="Point4" value="75">
                        <cfchartdata item="Point5" value="99">
            </cfchartseries>
</cfchart>
This code should give you the following picture
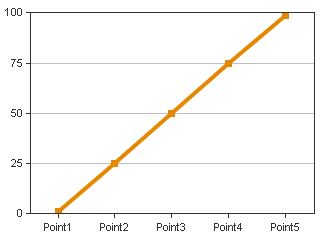
Note that our y-axis is from 0 to 100. Now lets increase the upper range of the axis to 200. So the code becomes:
<cfchart format="png" scalefrom="0" scaleTo="200" gridlines="5">
            <cfchartseries type="line">
                        <cfchartdata item="Point1" value="1">
                        <cfchartdata item="Point2" value="25">
                        <cfchartdata item="Point3" value="50">
                        <cfchartdata item="Point4" value="75">
                        <cfchartdata item="Point5" value="99">
            </cfchartseries>
</cfchart>
This code should give you the following picture
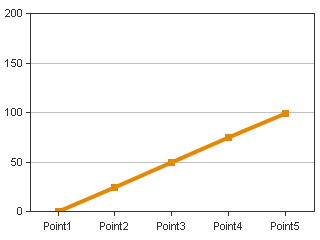
Observe that the graph appears to have been compressed vertically since we have doubled the vertical range.
Now lets play around and try to create an erroneous graph by introducing negative values but plotting only in the range from 0 to 100. Now the code is:
<cfchart format="png" scalefrom="0" scaleTo="100" gridlines="5">
            <cfchartseries type="line">
                        <cfchartdata item="Point1" value="-50">
                        <cfchartdata item="Point2" value="-25">
                        <cfchartdata item="Point3" value="1">
                        <cfchartdata item="Point4" value="25">
                        <cfchartdata item="Point5" value="50">
                        <cfchartdata item="Point6" value="75">
                        <cfchartdata item="Point7" value="99">
            </cfchartseries>
</cfchart>
This code should give you the following picture
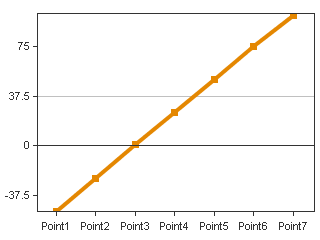
Here we can spot trouble! We observe that the gridlines have not come out properly, the reason for this is the following - the charting engine gives preference to the data passed, it will try to plot the entire data first and then try to scale it/adjust the gridlines accordingly. This problem is solved if you scale within proper range, lets say between -100 to 100. So the code becomes:
<cfchart format="png" scalefrom="-100" scaleTo="100" gridlines="5">
            <cfchartseries type="line">
                        <cfchartdata item="Point1" value="-50">
                        <cfchartdata item="Point2" value="-25">
                        <cfchartdata item="Point3" value="1">
                        <cfchartdata item="Point4" value="25">
                        <cfchartdata item="Point5" value="50">
                        <cfchartdata item="Point6" value="75">
                        <cfchartdata item="Point7" value="99">
            </cfchartseries>
</cfchart>
The graph you get is:
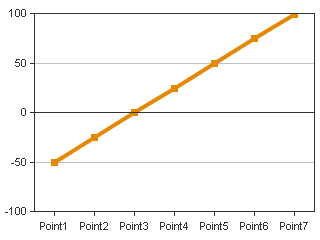
Obviously this isnt looking great, so we should probably decrease the lower range to -50, so the code is now:
<cfchart format="png" scalefrom="-50" scaleTo="100" gridlines="5">
            <cfchartseries type="line">
                        <cfchartdata item="Point1" value="-50">
                        <cfchartdata item="Point2" value="-25">
                        <cfchartdata item="Point3" value="1">
                        <cfchartdata item="Point4" value="25">
                        <cfchartdata item="Point5" value="50">
                        <cfchartdata item="Point6" value="75">
                        <cfchartdata item="Point7" value="99">
            </cfchartseries>
</cfchart>
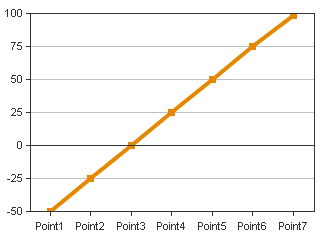
The image you get
Now this is looking completely offtrack !!
The trick is to know that "scaleFrom", "scaleTo" and "gridlines" work in conjunction.
Our range is from -50 to 100, so that is a difference of 100 - (-50) = 150, and the number of gridlines that we have specified is 5 - this will display 4 intervals in the graph now 150/4 gives you 37.5, so you see that the markers on the y-axis are at the lines -37.5,0,37.5 and 75, and the graph is looking odd.
Solution is to have the no. of gridlines so that your range can be divided into integral intervals,
so if I make gridlines=7, which means 6 intervals and 150/6 = 25,
I get a good looking graph:
The code for the same is this:
<cfchart format="png" scalefrom="-50" scaleTo="100" gridlines="7">
            <cfchartseries type="line">
                        <cfchartdata item="Point1" value="-50">
                        <cfchartdata item="Point2" value="-25">
                        <cfchartdata item="Point3" value="1">
                        <cfchartdata item="Point4" value="25">
                        <cfchartdata item="Point5" value="50">
                        <cfchartdata item="Point6" value="75">
                        <cfchartdata item="Point7" value="99">
            </cfchartseries>
</cfchart>
22 comments:
Any suggestions on how I get the scaling and gridlines to work with sub-integer ranges?
Specifically, when I specify scale from 0 to 0.5 with 6 lines, I'd expect to get a chart with gridlines at 0, .1, .2, .3, .4, and .5. Instead I get a chart from 0 to .21 (the max in my data set, which has 169 values) with 6 grid lines. I suspect the problem is related to the one you mention where the intervals should be integers, but when my total range is less than 1 that's not possible.
Also none of the data actually displays when I specify the type as bar chart; it will display data as a line chart, though the scaling is still off.
I have the chart update installed, and it fixed some problems but has not helped this one.
Congrats on setting this blog up. Could prove very useful
Couple of points
a) How do you install the hotfix. The instructions only appear to cover when J2EE on websphere
b)Using a query as the soource of data, i wish to have a scatter diagram
of hits and home runs at baseball
You can see an example here
i)The tip currently shows the x and y axis values. Is it also possible to add other data
from the query i.e. the players name?
ii) I wish to use the url property so that users can click on a datapoint
and move to a another page related to that player
e.g http://www.majorleaguecharts.com/
mlc/mlbCurrent.cfm?player=#playerID#
where playerID e.g palmera01 is part of the aforementioned query. Is this possible and, if so, how is it
done
@flummoxed
Have you applied the hotfix that I have talked about in my first post and also at the beginning of this post?
I have verified that the scaling works properly even with decimal values.
@andyc
All this has been documented in <cfchart> documentation and also in the coldfusion developer guide.
Regarding data drill down please refer to this link:
http://www.informit.com/articles/article.asp?p=31574&seqNum=4
I will put a post regarding data drill down, as and when I get time since this has been covered already in a lot of other places too.
Prayank
Thanks for the reply. I must be missing something. The only references to tips I could find in the CFCHART documentation are tipbgcolor and tipStyle. Nothing about content
Also the article you directed me to - although interesting - did not appear to cover my point
Let me be more specific. I use a query to obtain data I wish to plot. One of the items has the following properties
Name: Rafael Palmeiro
ID: palmera01
Hits: 3003
Home Runs: 566
I wish to plot the data along with those for other players on a scatter diagram. Home Runs on the y axis, Hits on x (though does not matter which). This works fine
On mouseOver I wish the tip to additionally show the Name (Rafael Palmeiro)
On onClick I wish to access a page with a URL of
http://www.majorleaguecharts.com/
mlc/mlbCurrent.cfm?player=palmera01
This is doable in Flash, but I prefer just to use CF, if possible
Thanks
Sorry when I say doable in flash
I mean in conjunction with a charting program
This is definitely doable in CF, you don’t need to learn flash for it.
And the page I mentioned, if you search around a bit and read the related pages and tutorial documentation you will find that how to create graphs from database queries using cfchart has been well documented
To be honest telling someone to "search around a bit" hardly meets the expectations of a blog entitled
"Looking for help with CFCHART?"
Which related pages? - I don't see any
What tutorial documentation -The CF stuff? I raised some specific points because the documentation does not appear to cover a couple of aspects which you claim are doable
I guess I'm sorry I didnt read your query properly. My mistake.
1. Well as you would have observed that the mouseover displays the column name /item name in the <cfchartdata& so you cannot change it to something altogether different.
2. Regarding going to some other link on clicking the chart, you might have missed that there is a url attribute in the cfchart tag which you can use to goto a generic page (same for each player) or to a specific page (different for each player) by using data drill down techniques which have been discussed in the link that i mentioned in one of my previous replies to your query.
Sorry for the trouble.
@andyc
Data drill down link
This should help you achieve your latter part of the query. (Its a bit old but still holds true in CF7)
Thanks for the reply but I'm afraid it looks like a no-go.
I have just acquired Ben Forta's WACK
and top p 454 states that passing anything other than the label and value of the datapoint is not currently possible in CF. Using a third variable e.g. playerID for drill-down is just impossible
I hope the fact that he uses 'currently' indicates that this is a possible enhancement down the line and if you have any influence could you add it to the wishlist
Thanks for your time
Prayank,
First of all, thank you for the great information you've provided here...you've been a lifesaver.
Now to my question. In your post, you say that the trick is to know that scaleto, scalefrom and gridlines work in conjunction, and in order to get an integer to display on the Y-axis we have to have the number of gridlines so that the range can be divided into integral intervals. Well, what if you don't know what your scaleto variable is?
I'm charting from a query that gets total # of data submittals. That number changes hourly and I don't really care what the numbers are, I just want to graph the data. My scalefrom is always zero, but if I hard-code the gridlines to 5 for example, depending on the data (the scaleto variable), the range may not be divisible into integral intervals.
My question is...is there some CF trick or code to dynamically assign the # of gridlines based on the data from a query that will make the intervals integers?
This chart is cool, and I want to ask you another type of cfchart in CF.
I got Voting Poll for singer in my site, and when users make their vote for their singer they can review the result in the chart. I used pie chart and flash output. The Y-Axis is for vote avergate, X-Axis is for singer name. My problem is that when I got about 100 singers in my site, the chart generated by CF is weird. It's seem that CF could not handle the large of column. Did u face with this problem before? Please tell me what I should do in this case?
TIA!
If your query has too many rows and your chart isn't wide enough you will get weird results with CFMX 7. Try stretching your chart to a much larger width and see if that helps. CFMX 6 didn't have this problem.
yZ1NZQ Your blog is great. Articles is interesting!
PzKDMp Thanks to author.
Good job!
actually, that's brilliant. Thank you. I'm going to pass that on to a couple of people.
Hello all!
Magnific!
Wonderful blog.
chwilowki przez sms
sugerowana strona
pożyczki pozabankowe w jakim banku
pożyczki bez bik od ręki
pożyczki bez bik
kredyt bez zabezpieczeń
pożyczka na dowód w uk
Post a Comment