Monday, July 18, 2005

Modifying look and feel of charts - Part I (very Basic)

You will need to use custom styles for this. Macromedia experience design team has designed the various style files that are lying in the <cfusion-install>\charting\styles directory. If you want to modify the look and feel of the charts that you create you will need to create your own custom files by modifying these default style files and using the "style" attribute in the <cfchart> tag. I will demonstrate this by increasing the width of lines in line charts.

By default the style that is used for bar/line charts is - default.xml and the one for pie charts is - default_pie.xml.

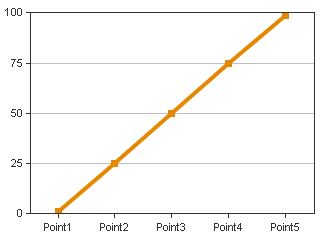
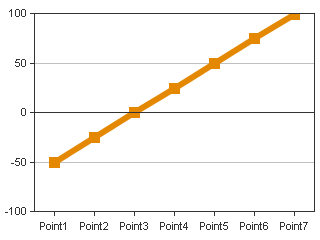
Before applying the style file our chart looks like this

The corresponding code for this chart is:

<cfchart format="png"
scalefrom="-100" scaleTo="100" gridlines="5">
<cfchartseries type="line">
<cfchartdata item="Point1" value="-50">
<cfchartdata item="Point2" value="-25">
<cfchartdata item="Point3" value="1">
<cfchartdata item="Point4" value="25">
<cfchartdata item="Point5" value="50">
<cfchartdata item="Point6" value="75">
<cfchartdata item="Point7" value="99">
</cfchartseries>
</cfchart>


Creating your own style file.
(this is the style file you will get - mystyle.xml)
  • Copy the default.xml file in <cfusion-install>\charting\styles directory to the directory where you have the .cfm of your line chart.
  • Rename this "default.xml" to "mystyle.xml"
  • For changing the line width the attribute that is used is "linewidth", in the <element> child tag of the xml document.
  • Locate this line in the xml document:
    <elements action="" shape="Area"
    drawOutline="false">
    modify it to the following:
    <elements action="" shape="Area"
    drawOutline="false" lineWidth="6">
  • Save the file, you have now created a custom style file.


Applying custom styles to charts
We will now apply the style file "mystyle.xml" we created above to our chart. This is very easy to do just use the "style" attribute in <cfchart> tag. Our code will now become:

<cfchart format="png"
scalefrom="-100" scaleTo="100" gridlines="5"
style="mystyle.xml">
<cfchartseries type="line">
<cfchartdata item="Point1" value="-50">
<cfchartdata item="Point2" value="-25">
<cfchartdata item="Point3" value="1">
<cfchartdata item="Point4" value="25">
<cfchartdata item="Point5" value="50">
<cfchartdata item="Point6" value="75">
<cfchartdata item="Point7" value="99">
</cfchartseries>
</cfchart>

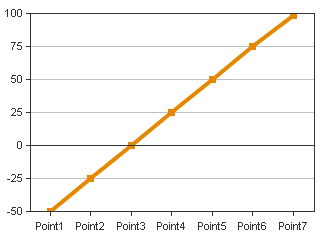
and our graph will look like:
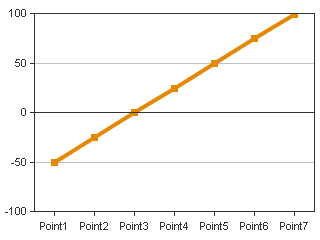

Comparison
Default line width

Line width = 6

Thursday, July 07, 2005

What's there in Merrimack?

NOTE for Merrimack Beta Customers: This has been posted with permission from CF team management. Merrimack Beta customers are NDA and not allowed to disclose details about it. (You can say being on the engineering team of CF, has its priviledges ;-)

The updater for CF7 has been code named "Merrimack", and will be out shortly. It is currently in the Beta phase.

Merrimack is an incremental release designed to update platform support, roll up all hot fixes and security fixes to-date, update internal OEM technology with new patches and bug fixes, and includes some small incremental functional improvements over the ColdFusion MX 7 release.

In addition to including nearly 200 bug fixes, the ColdFusion MX 7 Updater Beta includes new support for the following platforms:

  • Windows 2003 Service Pack 1
  • Red Hat Linux AS 3.0 and 4.0
  • SuSE Linux Enterprise Server 8 and 9
  • AIX 5L v5.1, v5.2, and v5.3
  • IBM WebSphere Application Server (WAS) Network Deploy (ND)
  • Oracle Application Server 10g
  • Some basic support for IPv6
  • A full Mac OSX Installer, with an install experience similar to that on Windows
  • Oracle 10g RDBMS support (note that 10g Real Application Clusters (RAC) are not supported with the Updater)

Some of the additional Updater internal updated technology includes:
- Axis version 1.2.1 (Final)
- JRun Updater 5 + hot fixes
- Verity 5.5 Patch Level 19
- Other key internal OEM technology updates and fixes

In addition to the bug fixes and new platform support, the updater will contain some small feature enhancements including Java CFCProxy support for calling CFC's directly from Java in Enterprise Edition, some small tag attribute enhancements, a small number of new CFML functions, including EncryptBinary(), DecryptBinary(), GetLocalHostIP(), IsLocalHost(), SMS Gateway character set & data encoding enhancements, CFPOP image attachment enhancements, and more.

scaleFrom, scaleTo and gridlines

Prerequisite:
You will need to have applied the charting hotfix (find it here) to your CF7 installation.

Using scaling is a breeze in CF7 after you have installed the above given hotfix. The idea behing "scaleTo" and "scaleFrom" attributes is to specify the y-axis range of your charts. I will illustrate this by plotting five points: 1, 25, 50, 75, 99 on a line graph. This chart can be plotted by the following code:


<cfchart format="png" scalefrom="0" scaleTo="100" gridlines="5">
<cfchartseries type="line">
<cfchartdata item="Point1" value="1">
<cfchartdata item="Point2" value="25">
<cfchartdata item="Point3" value="50">
<cfchartdata item="Point4" value="75">
<cfchartdata item="Point5" value="99">
</cfchartseries>
</cfchart>

This code should give you the following picture


Note that our y-axis is from 0 to 100. Now lets increase the upper range of the axis to 200. So the code becomes:

<cfchart format="png" scalefrom="0" scaleTo="200" gridlines="5">
<cfchartseries type="line">
<cfchartdata item="Point1" value="1">
<cfchartdata item="Point2" value="25">
<cfchartdata item="Point3" value="50">
<cfchartdata item="Point4" value="75">
<cfchartdata item="Point5" value="99">
</cfchartseries>
</cfchart>

This code should give you the following picture

Observe that the graph appears to have been compressed vertically since we have doubled the vertical range.

Now lets play around and try to create an erroneous graph by introducing negative values but plotting only in the range from 0 to 100. Now the code is:

<cfchart format="png" scalefrom="0" scaleTo="100" gridlines="5">
<cfchartseries type="line">
<cfchartdata item="Point1" value="-50">
<cfchartdata item="Point2" value="-25">

<cfchartdata item="Point3" value="1">
<cfchartdata item="Point4" value="25">
<cfchartdata item="Point5" value="50">
<cfchartdata item="Point6" value="75">
<cfchartdata item="Point7" value="99">
</cfchartseries>
</cfchart>

This code should give you the following picture

Here we can spot trouble! We observe that the gridlines have not come out properly, the reason for this is the following - the charting engine gives preference to the data passed, it will try to plot the entire data first and then try to scale it/adjust the gridlines accordingly. This problem is solved if you scale within proper range, lets say between -100 to 100. So the code becomes:

<cfchart format="png" scalefrom="-100" scaleTo="100" gridlines="5">
<cfchartseries type="line">
<cfchartdata item="Point1" value="-50">
<cfchartdata item="Point2" value="-25">
<cfchartdata item="Point3" value="1">
<cfchartdata item="Point4" value="25">
<cfchartdata item="Point5" value="50">
<cfchartdata item="Point6" value="75">
<cfchartdata item="Point7" value="99">
</cfchartseries>
</cfchart>

The graph you get is:

Obviously this isnt looking great, so we should probably decrease the lower range to -50, so the code is now:

<cfchart format="png" scalefrom="-50" scaleTo="100" gridlines="5">
<cfchartseries type="line">
<cfchartdata item="Point1" value="-50">
<cfchartdata item="Point2" value="-25">
<cfchartdata item="Point3" value="1">
<cfchartdata item="Point4" value="25">
<cfchartdata item="Point5" value="50">
<cfchartdata item="Point6" value="75">
<cfchartdata item="Point7" value="99">
</cfchartseries>
</cfchart>

The image you get

Now this is looking completely offtrack !!
The trick is to know that "scaleFrom", "scaleTo" and "gridlines" work in conjunction.
Our range is from -50 to 100, so that is a difference of 100 - (-50) = 150, and the number of gridlines that we have specified is 5 - this will display 4 intervals in the graph now 150/4 gives you 37.5, so you see that the markers on the y-axis are at the lines -37.5,0,37.5 and 75, and the graph is looking odd.

Solution is to have the no. of gridlines so that your range can be divided into integral intervals,
so if I make gridlines=7, which means 6 intervals and 150/6 = 25,
I get a good looking graph:

The code for the same is this:

<cfchart format="png" scalefrom="-50" scaleTo="100" gridlines="7">
<cfchartseries type="line">
<cfchartdata item="Point1" value="-50">
<cfchartdata item="Point2" value="-25">
<cfchartdata item="Point3" value="1">
<cfchartdata item="Point4" value="25">
<cfchartdata item="Point5" value="50">
<cfchartdata item="Point6" value="75">
<cfchartdata item="Point7" value="99">
</cfchartseries>
</cfchart>

Tuesday, July 05, 2005

Merrimack and Scorpio - if you don't know already.

Exciting news for Coldfusion users - on June 29, 2005 at the CFUnited conference in Washington (I was not unfortunately able to make to the conference) : Macromedia announced that the development on the next version of Coldfusion - CF8 has already started. CF8 has been codenamed - "Scorpio", for the eighth sign of the zodiac. Though I had suggested the name of "HighOctane" to the team, alas - Scorpio came out the clear winner. Other names that were rejected were:

- Europa
- Bodacious
- Himalaya
- Neptune
- Whitefield
- CrazyGlue
- RedOctober

Another good news is that the updater for CF7 - codenamed "Merrimack" - is now in the Beta phase. And is will released soon enough, for the CF7 users to savor.

For more info on CFUNITED check out:
Rob Brooks-Bilson's Blog
Willy Chang's Blog