Recently I got a mail from Brian Simmons, announcing the release of CFMX 7 Exam Buster.
In my opinion it is a really cool software for those preparing for CFMX 7 certification. I myself had used the software (though older version) for my CFMX 6.1 certification. I'll paraphrase the CFMX7 press release note :
============================================================
CFMX Exam Buster 7.0 from CentraSoft (http://centrasoft.com)
CFMX Exam Buster 7.0 is the ultimate testing tool specifically designed to help ColdFusion MX 7.0 developers earn their ColdFusion MX 7.0 Certification through the Macromedia Certified Professional Program.
CFMX Exam Buster 7.0 has 875 questions designed to help you prepare for all aspects of the actual ColdFusion MX 7.0 Certification exam. CFMX Exam Buster 7.0 allows you to take thirteen different tests, topic tests for your weak areas, and the ability to create random tests.
All 875 questions have explanations and reference URLs to further aid your studies and build your ColdFusion knowledge.
During your test you can save your test in progress, submit comments, bookmark questions, pause your test, and much more. You can control the look and feel of the CFMX Exam Buster 7.0 application, by setting the fonts, colors, and appearance of many controls, to create a studying environment with which you are comfortable. After your test is scored, you will be shown a comprehensive breakdown of your test results.
There is a DEMO version on the Centrasoft website (http://www.centrasoft.com), which allows you to check out all the features of the program, plus one whole test. At this moment the demo is still for the 6.0 exam, we will be releasing a 7.0 demo in the upcoming days.
I'm always asked whether CFMX Exam Buster works, and I'm proud to say that I obtained my Advanced ColdFusion MX 7.0 Developer Certification (6/3/05) and the ONLY study aid I used was my own CFMX Exam Buster 7.0. Worked like a charm.
Check out CFMX Exam Buster 7.0 today!
Thanks,
Brian Simmons
bsimmons@centrasoft.com
The ultimate ColdFusion MX 7.0 Certification testing tool:
Check out CFMX Exam Buster 7.0 at: http://centrasoft.com
ColdFusion MX, and Macromedia are registered trademarks of Macromedia
Corporation. Macromedia Corporation in no way endorses or is affiliated with
Centrasoft Corporation.
============================================================
Monday, August 01, 2005
CFMX 7 Certification Software?
Monday, July 18, 2005
Modifying look and feel of charts - Part I (very Basic)
You will need to use custom styles for this. Macromedia experience design team has designed the various style files that are lying in the <cfusion-install>\charting\styles directory. If you want to modify the look and feel of the charts that you create you will need to create your own custom files by modifying these default style files and using the "style" attribute in the <cfchart> tag. I will demonstrate this by increasing the width of lines in line charts.
By default the style that is used for bar/line charts is - default.xml and the one for pie charts is - default_pie.xml.
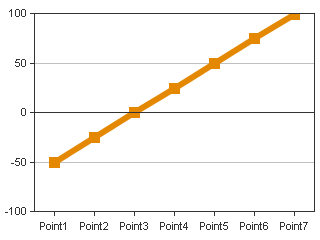
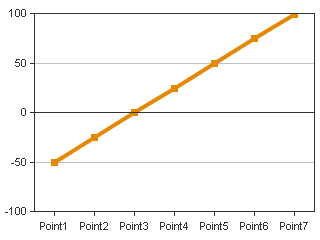
Before applying the style file our chart looks like this
The corresponding code for this chart is:
<cfchart format="png"
                 scalefrom="-100" scaleTo="100" gridlines="5">
            <cfchartseries type="line">
                        <cfchartdata item="Point1" value="-50">
                        <cfchartdata item="Point2" value="-25">
                        <cfchartdata item="Point3" value="1">
                        <cfchartdata item="Point4" value="25">
                        <cfchartdata item="Point5" value="50">
                        <cfchartdata item="Point6" value="75">
                        <cfchartdata item="Point7" value="99">
            </cfchartseries>
</cfchart>
Creating your own style file.
(this is the style file you will get - mystyle.xml)
- Copy the default.xml file in <cfusion-install>\charting\styles directory to the directory where you have the .cfm of your line chart.
- Rename this "default.xml" to "mystyle.xml"
- For changing the line width the attribute that is used is "linewidth", in the <element> child tag of the xml document.
- Locate this line in the xml document:
<elements action="" shape="Area"
modify it to the following:
drawOutline="false"><elements action="" shape="Area"
drawOutline="false" lineWidth="6"> - Save the file, you have now created a custom style file.
Applying custom styles to charts
We will now apply the style file "mystyle.xml" we created above to our chart. This is very easy to do just use the "style" attribute in <cfchart> tag. Our code will now become:
<cfchart format="png"
                 scalefrom="-100" scaleTo="100" gridlines="5"
                 style="mystyle.xml">
            <cfchartseries type="line">
                        <cfchartdata item="Point1" value="-50">
                        <cfchartdata item="Point2" value="-25">
                        <cfchartdata item="Point3" value="1">
                        <cfchartdata item="Point4" value="25">
                        <cfchartdata item="Point5" value="50">
                        <cfchartdata item="Point6" value="75">
                        <cfchartdata item="Point7" value="99">
            </cfchartseries>
</cfchart>
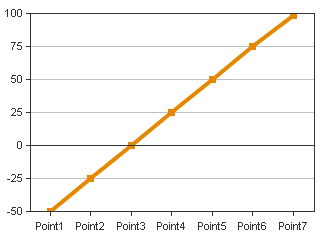
and our graph will look like:
Comparison
Default line width
Line width = 6
Thursday, July 07, 2005
What's there in Merrimack?
NOTE for Merrimack Beta Customers: This has been posted with permission from CF team management. Merrimack Beta customers are NDA and not allowed to disclose details about it. (You can say being on the engineering team of CF, has its priviledges ;-)
The updater for CF7 has been code named "Merrimack", and will be out shortly. It is currently in the Beta phase.
Merrimack is an incremental release designed to update platform support, roll up all hot fixes and security fixes to-date, update internal OEM technology with new patches and bug fixes, and includes some small incremental functional improvements over the ColdFusion MX 7 release.
In addition to including nearly 200 bug fixes, the ColdFusion MX 7 Updater Beta includes new support for the following platforms:
- Windows 2003 Service Pack 1
- Red Hat Linux AS 3.0 and 4.0
- SuSE Linux Enterprise Server 8 and 9
- AIX 5L v5.1, v5.2, and v5.3
- IBM WebSphere Application Server (WAS) Network Deploy (ND)
- Oracle Application Server 10g
- Some basic support for IPv6
- A full Mac OSX Installer, with an install experience similar to that on Windows
- Oracle 10g RDBMS support (note that 10g Real Application Clusters (RAC) are not supported with the Updater)
Some of the additional Updater internal updated technology includes:
- Axis version 1.2.1 (Final)
- JRun Updater 5 + hot fixes
- Verity 5.5 Patch Level 19
- Other key internal OEM technology updates and fixes
In addition to the bug fixes and new platform support, the updater will contain some small feature enhancements including Java CFCProxy support for calling CFC's directly from Java in Enterprise Edition, some small tag attribute enhancements, a small number of new CFML functions, including EncryptBinary(), DecryptBinary(), GetLocalHostIP(), IsLocalHost(), SMS Gateway character set & data encoding enhancements, CFPOP image attachment enhancements, and more.
scaleFrom, scaleTo and gridlines
Prerequisite:
You will need to have applied the charting hotfix (find it here) to your CF7 installation.
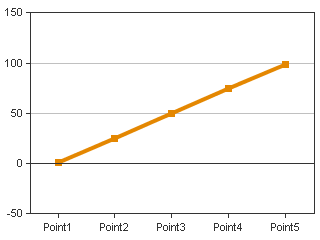
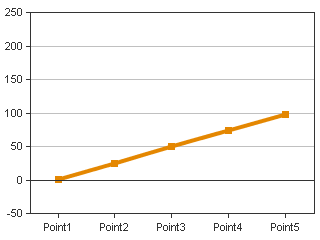
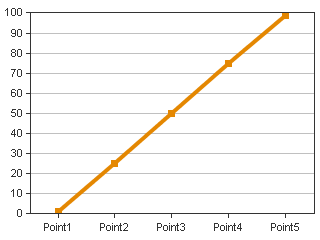
Using scaling is a breeze in CF7 after you have installed the above given hotfix. The idea behing "scaleTo" and "scaleFrom" attributes is to specify the y-axis range of your charts. I will illustrate this by plotting five points: 1, 25, 50, 75, 99 on a line graph. This chart can be plotted by the following code:
<cfchart format="png" scalefrom="0" scaleTo="100" gridlines="5">
            <cfchartseries type="line">
                        <cfchartdata item="Point1" value="1">
                        <cfchartdata item="Point2" value="25">
                        <cfchartdata item="Point3" value="50">
                        <cfchartdata item="Point4" value="75">
                        <cfchartdata item="Point5" value="99">
            </cfchartseries>
</cfchart>
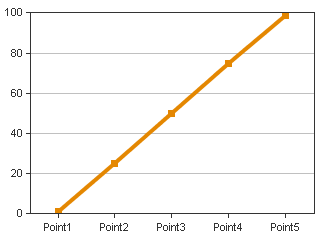
This code should give you the following picture
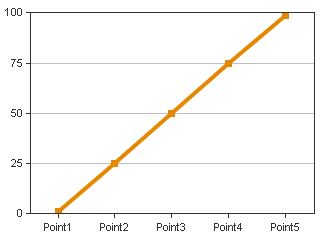
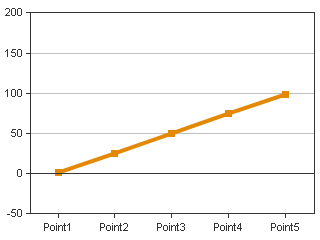
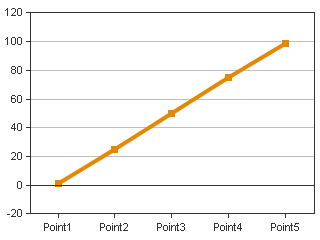
Note that our y-axis is from 0 to 100. Now lets increase the upper range of the axis to 200. So the code becomes:
<cfchart format="png" scalefrom="0" scaleTo="200" gridlines="5">
            <cfchartseries type="line">
                        <cfchartdata item="Point1" value="1">
                        <cfchartdata item="Point2" value="25">
                        <cfchartdata item="Point3" value="50">
                        <cfchartdata item="Point4" value="75">
                        <cfchartdata item="Point5" value="99">
            </cfchartseries>
</cfchart>
This code should give you the following picture
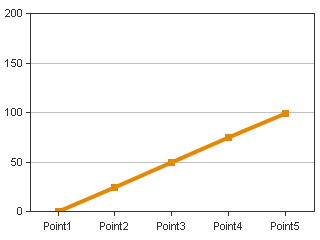
Observe that the graph appears to have been compressed vertically since we have doubled the vertical range.
Now lets play around and try to create an erroneous graph by introducing negative values but plotting only in the range from 0 to 100. Now the code is:
<cfchart format="png" scalefrom="0" scaleTo="100" gridlines="5">
            <cfchartseries type="line">
                        <cfchartdata item="Point1" value="-50">
                        <cfchartdata item="Point2" value="-25">
                        <cfchartdata item="Point3" value="1">
                        <cfchartdata item="Point4" value="25">
                        <cfchartdata item="Point5" value="50">
                        <cfchartdata item="Point6" value="75">
                        <cfchartdata item="Point7" value="99">
            </cfchartseries>
</cfchart>
This code should give you the following picture
Here we can spot trouble! We observe that the gridlines have not come out properly, the reason for this is the following - the charting engine gives preference to the data passed, it will try to plot the entire data first and then try to scale it/adjust the gridlines accordingly. This problem is solved if you scale within proper range, lets say between -100 to 100. So the code becomes:
<cfchart format="png" scalefrom="-100" scaleTo="100" gridlines="5">
            <cfchartseries type="line">
                        <cfchartdata item="Point1" value="-50">
                        <cfchartdata item="Point2" value="-25">
                        <cfchartdata item="Point3" value="1">
                        <cfchartdata item="Point4" value="25">
                        <cfchartdata item="Point5" value="50">
                        <cfchartdata item="Point6" value="75">
                        <cfchartdata item="Point7" value="99">
            </cfchartseries>
</cfchart>
The graph you get is:
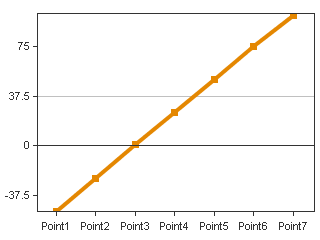
Obviously this isnt looking great, so we should probably decrease the lower range to -50, so the code is now:
<cfchart format="png" scalefrom="-50" scaleTo="100" gridlines="5">
            <cfchartseries type="line">
                        <cfchartdata item="Point1" value="-50">
                        <cfchartdata item="Point2" value="-25">
                        <cfchartdata item="Point3" value="1">
                        <cfchartdata item="Point4" value="25">
                        <cfchartdata item="Point5" value="50">
                        <cfchartdata item="Point6" value="75">
                        <cfchartdata item="Point7" value="99">
            </cfchartseries>
</cfchart>
The image you get
Now this is looking completely offtrack !!
The trick is to know that "scaleFrom", "scaleTo" and "gridlines" work in conjunction.
Our range is from -50 to 100, so that is a difference of 100 - (-50) = 150, and the number of gridlines that we have specified is 5 - this will display 4 intervals in the graph now 150/4 gives you 37.5, so you see that the markers on the y-axis are at the lines -37.5,0,37.5 and 75, and the graph is looking odd.
Solution is to have the no. of gridlines so that your range can be divided into integral intervals,
so if I make gridlines=7, which means 6 intervals and 150/6 = 25,
I get a good looking graph:
The code for the same is this:
<cfchart format="png" scalefrom="-50" scaleTo="100" gridlines="7">
            <cfchartseries type="line">
                        <cfchartdata item="Point1" value="-50">
                        <cfchartdata item="Point2" value="-25">
                        <cfchartdata item="Point3" value="1">
                        <cfchartdata item="Point4" value="25">
                        <cfchartdata item="Point5" value="50">
                        <cfchartdata item="Point6" value="75">
                        <cfchartdata item="Point7" value="99">
            </cfchartseries>
</cfchart>
Tuesday, July 05, 2005
Merrimack and Scorpio - if you don't know already.
Exciting news for Coldfusion users - on June 29, 2005 at the CFUnited conference in Washington (I was not unfortunately able to make to the conference) : Macromedia announced that the development on the next version of Coldfusion - CF8 has already started. CF8 has been codenamed - "Scorpio", for the eighth sign of the zodiac. Though I had suggested the name of "HighOctane" to the team, alas - Scorpio came out the clear winner. Other names that were rejected were:
- Europa
- Bodacious
- Himalaya
- Neptune
- Whitefield
- CrazyGlue
- RedOctober
Another good news is that the updater for CF7 - codenamed "Merrimack" - is now in the Beta phase. And is will released soon enough, for the CF7 users to savor.
For more info on CFUNITED check out:
Rob Brooks-Bilson's Blog
Willy Chang's Blog
Thursday, June 23, 2005
Image expired trouble?
Problem
The following message is shown instead of the graphs:
"Image Expired
Please refresh the page
To view the image"
Lot of people have faced this problem, the reason is the timeout in the caching engine of the Coldfusion keeps the charts for any request only for a default value of 5 seconds.
We missed providing an interface to change this value in the CF Admin, but you can still change this value by:
1. Stop the CF server.
2. Open <cf install path>\lib\webcharts3d.xml
3. You can increase the timeout for keeping the graphs in the cache by editing the minTimeout and maxTimeout attributes:
<?xml version="1.0" encoding="UTF-8"?>
<server image="PNG" cache="Memory" minTimeout="5000" maxTimeout="30000"....
change this to whatever values you want.(Values of minTimeout and maxTimeout are in milliseconds.)
The minTimeout and maxTimeout are per each request, i.e. the graphing cache will keep the graphs for each request for minTimeout amount of time. So if there are 4 graphs in one page then request for the page arrives at lets say 1'o clock and the min timeout is 5 secs, then each graph for the request will be kept only in cache for 1'o clock + time to generate graph + minTimeout. So a problem could be if the last graph takes lets say 10 secs to generate, then by the time it is ready all the previous graphs will timeout and will be removed from the cached.
This can create a problem when:
- There are a large number of charts one page (> 200). In this case, some charts will be drawn but remaining charts will display the error message
- There are only a few charts on a page but some charts take more than minTimeOut amount of time to generate in this case the remaining charts will not be generated and the error message will be thrown.
Flash charts crashing Apache/IIS?
Yesterday an issue on flash charts generated via <cfchart> was reported on the forums - read here.
I will just surmise the discussion (thanks a lot to Tiamat74 for his solution).
Problem
Credit: Chris Brandt, sdowle & "is me"
Environment specs :
- XP pro, IIS
- win2k sp3 or winxp sp2 , apache, mdac2.8 , jre1.4.2_07
- Apache 2.0.53, WinXP
On creating flash charts in CF7, the following errors occurs:
Server Error
The server encountered an internal error and was unable to complete your request.
JRun closed connection.
Though jpeg and gif charts work fine.
Solution
Credit: Tiamat74
This issue is actually caused by a corrupted font in your systems font folder, which in turn produces an error in the jre. Please go here for additional information:
The work around I used to fix this issue on my server was to move all of my fonts from the window/font folder to a temporary folder. If you are using windows, it should install the basic fonts needed to run windows. After that cfchart worked fine.
Another option is to go through all of your fonts to see which one is corrupted.
Tuesday, June 21, 2005
Charting Technote Addendum
Macromedia came out with a fix for some issues in cfchart implementation, it can be accessed here - Charting Technote
This blog will try to elborate on this fix. You will need to download the supplied files in the technote to follow the instructions
NOTE: Please take backup of all files (take backup in a folder outside <cfinstall>\lib) that you change during installation, so that you can revert to your old configuration just in case you face some problems after this fix. While backing up wc50.jar please ensure that
- Shutdown CF server.
- Replace wc50.jar in <cfinstall-path>\lib directory, with supplied file.
- Replace webcharts3D.xml in <cfinstall-path>\lib directory, with supplied file.
- Copy supplied style files (in styles folder) to <cfinstall-path>\charting\styles directory. (overwrite existing files)
- Start CF server.
- You are ready to go.
This technote fixes the following bugs:
60028 – Scaling & gridlines problems have been resolved.
57581 – Line charts no longer display negative axis if any values are 0.
59943 – Users can format legend text in pie charts.
59466 – X axis titles are not rotated if too long ( advisory )
59162 – Barcharts with only one data series will be displayed
NOTE: To use most of these fixes/features, users will be required to create their own styles. Please take some time in experimenting with creating and applying your own styles to cfchart. A speed-up for the same is discussed here.
Description:
60028 – Scaling & gridlines problems have been resolved.
Issue
Users were unable to control the scaling of the graphs that were being generated. The scaleTo and scaleFrom attributes in <cfchart> were not being followed by the charting engine. In some cases the y-axis were scaled to many times the maximum range of the data.
Solution
This problem has now been fixed. Users can set the minimum and maximum values that would be displayed in the charts. If no gridlines are specified then the default no. of lines that are drawn will be 11. Users have to be careful in selecting the values of scaleTo, scaleFrom and gridlines. If the difference of scaleTo and scaleFrom is not divisible by gridlines then labels with lot of decimal places will be displayed e.g.
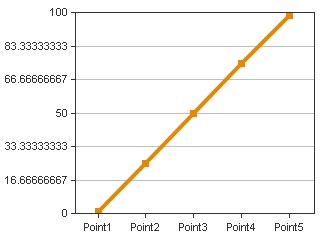
Users can overcome this by applying custom styles where the labels are formatted to be integers, and not fractional values.
57581 – Line charts no longer display negative axis if any values are 0
Issue
Users plotting any data with data points 0 or close to zero, observe that their charts display negative axes. This behavior is observed since the charting engine of CFMX tries to prevent any part of the graph from being clipped – this is known as the “AutoAdjust” feature. Hence in order to prevent clipping of markers the charting engine draws the negative axes.
Solution
The AutoAdjust feature was “true” by default. The new style files, have been modified to turn off this feature by default. Users can deploy the new files to revert to the original charting behaviour as it was in CF 6.1. For those users who want to still use this feature, they are advised to deploy the provided style files and change the value of autoAdjust attribute to “true”.
59943 – Users can format legend text in pie charts
Issue
Users were able to change the legend text for pie charts in CF 6.1. They are unable to do so in CFMX.
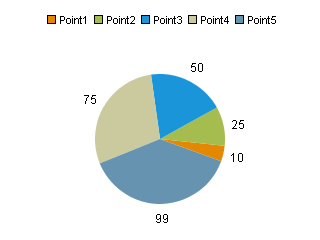
Solution
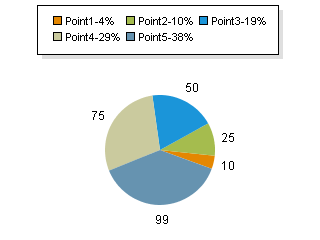
Users should use the webcharts designer to create custom style xml which can be then applied, to modify the legend in pie charts and other graphs, e.g. the above pie chart was modified to the one below by applying a style file with the following attribute:
  <legend>
   <![CDATA[ $(colLabel)-$(colPercent)  ]]>
  </legend>
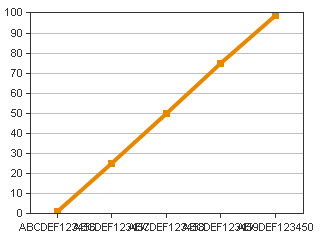
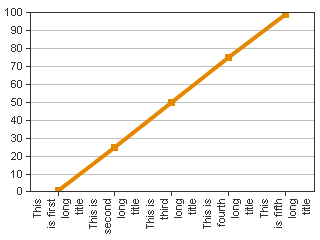
59466 – X axis titles are not rotated if too long (Advisory: change of behavior)
Issue
In CF 6.1, the X-axis titles were vertical by default. So any long titles like – “AAAAAAAAAAAAA” were displayed still by scaling the graph. However, in CFMX these titles are not being rotated.
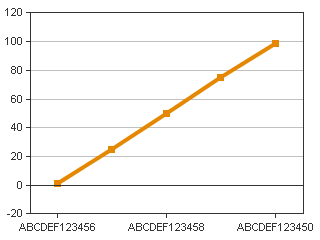
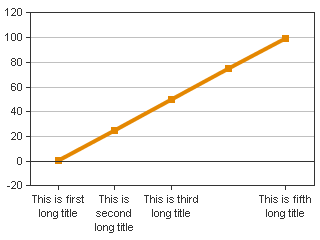
Solution
Please note this is a change in default behavior – made on the recommendations of the eXperience Design team at Macromedia Inc. In CFMX, the titles have been made horizontal by default – thus any long title names get clipped (are not shown). Users can revert back to the old functionality in two ways:
Method 1: Modify all default style files.
(This is not the recommended method since all graphs will be affected by this change)
- The default style files are in the folder - <cfinstall dir>\charting\styles
- Users need to edit the files which do not have the *_pie.xml ending
- The following lines need to be changed:
<xAxis>
 <labelStyle isHideOverlapped="true" orientation="Horizontal"/>
 <titleStyle font="Arial-12-bold" isMultiline="false"/>
</xAxis>
To the following:
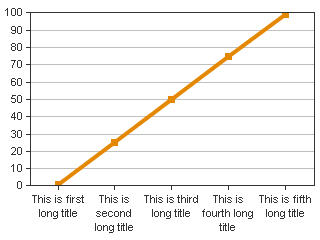
Here, isHideOverLapped attribute is set to false so those titles which overlap will also be displayed.
<xAxis>
 <labelStyle isHideOverlapped="false" orientation="Horizontal"/>
 <titleStyle font="Arial-12-bold" isMultiline="false"/>
</xAxis>
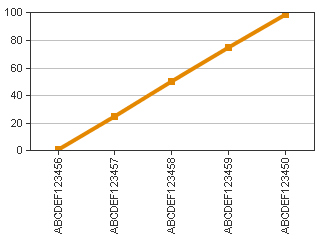
The following will make label orientation vertical
<xAxis>
 <labelStyle isHideOverlapped="false" orientation="Vertical"/>
 <titleStyle font="Arial-12-bold" isMultiline="false"/>
</xAxis>
Users will need to make similar changes to the <yAxis> section for changing the behavior for horizontal bar graphs.
Method 2: Using custom style files
- Read the section on creating custom style files.
- And apply step 3 in Method 1 to change the required attributes.
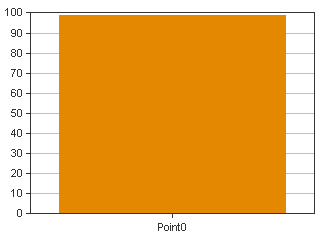
59162 – Barcharts with only one data series will be displayed
Issue
CFMX charting engine does not display charts properly if a single data series is defined and the seriesplacement attribute in <cfchart> is set to “stacked”.
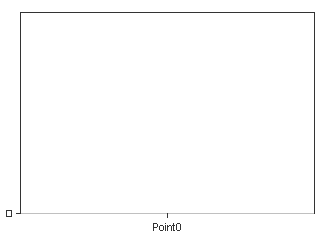
Solution
These graphs are now rendered properly.
How to create your own styles for charts?
Applying custom styles to cfchart tag
- Create a custom style by using the webcharts designer. (<cfinstall>\charting\webcharts.bat)
- The custom style is in the style tab of the webcharts GUI.
- Save this xml in a file to your web root/ directory where you have the cfm to create the graph. (e.g. you save the file by name "myStyle.xml" in wwwroot\charts directory.
- Use the "style" attribute to import these settings in the <cfchart> tag. e.g. you have cfm in wwwroot folder then you can say –
<cfchart style="charts\myStyle.xml" .... other attributes>