Macromedia came out with a fix for some issues in cfchart implementation, it can be accessed here - Charting Technote
This blog will try to elborate on this fix. You will need to download the supplied files in the technote to follow the instructions
NOTE: Please take backup of all files (take backup in a folder outside <cfinstall>\lib) that you change during installation, so that you can revert to your old configuration just in case you face some problems after this fix. While backing up wc50.jar please ensure that
- Shutdown CF server.
- Replace wc50.jar in <cfinstall-path>\lib directory, with supplied file.
- Replace webcharts3D.xml in <cfinstall-path>\lib directory, with supplied file.
- Copy supplied style files (in styles folder) to <cfinstall-path>\charting\styles directory. (overwrite existing files)
- Start CF server.
- You are ready to go.
This technote fixes the following bugs:
60028 – Scaling & gridlines problems have been resolved.
57581 – Line charts no longer display negative axis if any values are 0.
59943 – Users can format legend text in pie charts.
59466 – X axis titles are not rotated if too long ( advisory )
59162 – Barcharts with only one data series will be displayed
NOTE: To use most of these fixes/features, users will be required to create their own styles. Please take some time in experimenting with creating and applying your own styles to cfchart. A speed-up for the same is discussed here.
Description:
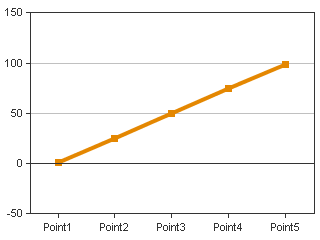
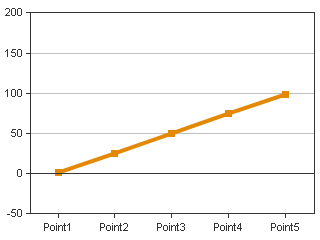
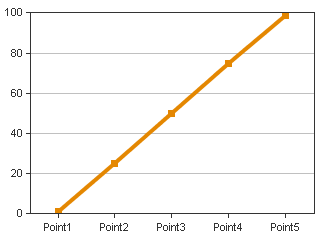
60028 – Scaling & gridlines problems have been resolved. Issue Users were unable to control the scaling of the graphs that were being generated. The scaleTo and scaleFrom attributes in <cfchart> were not being followed by the charting engine. In some cases the y-axis were scaled to many times the maximum range of the data.
 Solution
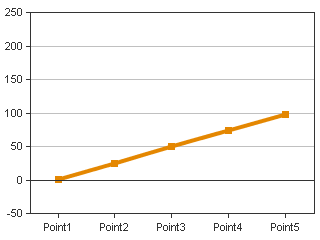
 This problem has now been fixed. Users can set the minimum and maximum values that would be displayed in the charts. If no gridlines are specified then the default no. of lines that are drawn will be 11. Users have to be careful in selecting the values of scaleTo, scaleFrom and gridlines. If the difference of scaleTo and scaleFrom is not divisible by gridlines then labels with lot of decimal places will be displayed e.g.
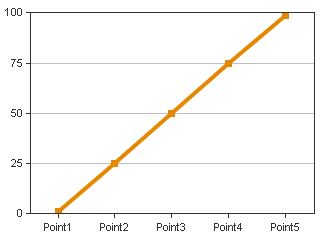
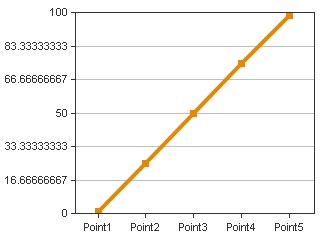
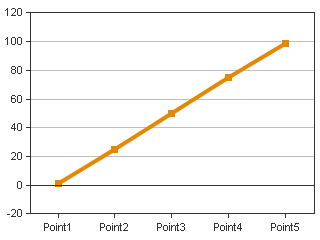
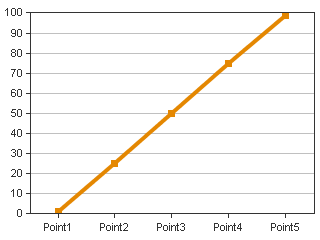
Users can overcome this by applying custom styles where the labels are formatted to be integers, and not fractional values.
57581 – Line charts no longer display negative axis if any values are 0 Issue Users plotting any data with data points 0 or close to zero, observe that their charts display negative axes. This behavior is observed since the charting engine of CFMX tries to prevent any part of the graph from being clipped – this is known as the “AutoAdjust” feature. Hence in order to prevent clipping of markers the charting engine draws the negative axes.
Solution
The AutoAdjust feature was “true” by default. The new style files, have been modified to turn off this feature by default. Users can deploy the new files to revert to the original charting behaviour as it was in CF 6.1. For those users who want to still use this feature, they are advised to deploy the provided style files and change the value of autoAdjust attribute to “true”.
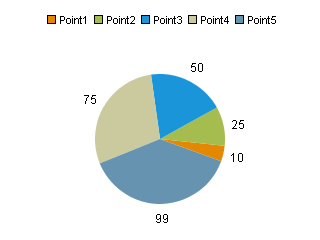
59943 – Users can format legend text in pie charts
Issue
Users were able to change the legend text for pie charts in CF 6.1. They are unable to do so in CFMX.
Solution
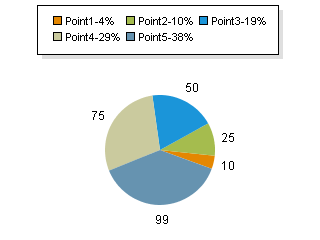
Users should use the webcharts designer to create custom style xml which can be then applied, to modify the legend in pie charts and other graphs, e.g. the above pie chart was modified to the one below by applying a style file with the following attribute:
  <legend>
   <![CDATA[ $(colLabel)-$(colPercent)  ]]>
  </legend>
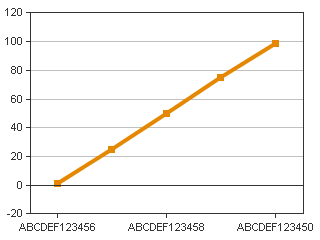
59466 – X axis titles are not rotated if too long (Advisory: change of behavior)
Issue
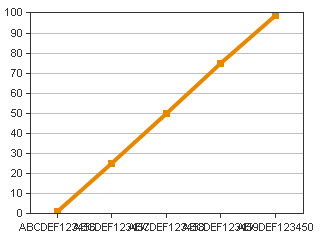
In CF 6.1, the X-axis titles were vertical by default. So any long titles like – “AAAAAAAAAAAAA” were displayed still by scaling the graph. However, in CFMX these titles are not being rotated.
Solution
Please note this is a change in default behavior – made on the recommendations of the eXperience Design team at Macromedia Inc. In CFMX, the titles have been made horizontal by default – thus any long title names get clipped (are not shown). Users can revert back to the old functionality in two ways:
Method 1: Modify all default style files.
(This is not the recommended method since all graphs will be affected by this change)
- The default style files are in the folder - <cfinstall dir>\charting\styles
- Users need to edit the files which do not have the *_pie.xml ending
- The following lines need to be changed:
<xAxis>
 <labelStyle isHideOverlapped="true" orientation="Horizontal"/>
 <titleStyle font="Arial-12-bold" isMultiline="false"/>
</xAxis>
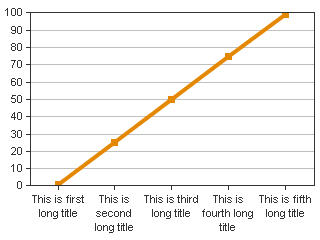
To the following:
Here, isHideOverLapped attribute is set to false so those titles which overlap will also be displayed.
<xAxis>
 <labelStyle isHideOverlapped="false" orientation="Horizontal"/>
 <titleStyle font="Arial-12-bold" isMultiline="false"/>
</xAxis>
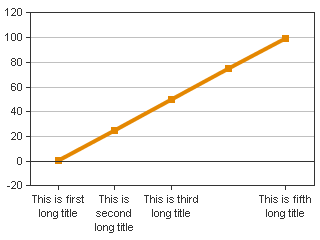
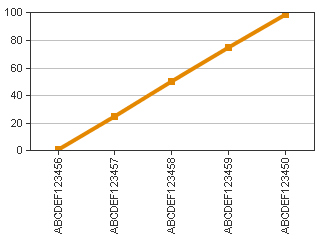
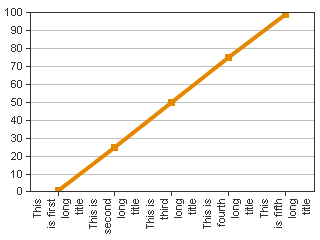
The following will make label orientation vertical
<xAxis>
 <labelStyle isHideOverlapped="false" orientation="Vertical"/>
 <titleStyle font="Arial-12-bold" isMultiline="false"/>
</xAxis>
Users will need to make similar changes to the <yAxis> section for changing the behavior for horizontal bar graphs.
Method 2: Using custom style files
- Read the section on creating custom style files.
- And apply step 3 in Method 1 to change the required attributes.
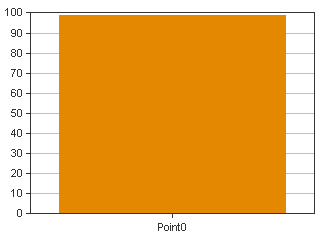
59162 – Barcharts with only one data series will be displayed
Issue
CFMX charting engine does not display charts properly if a single data series is defined and the seriesplacement attribute in <cfchart> is set to “stacked”.
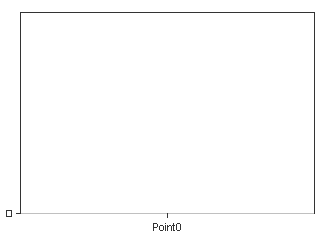
Solution
These graphs are now rendered properly.
How to create your own styles for charts?
Applying custom styles to cfchart tag
- Create a custom style by using the webcharts designer. (<cfinstall>\charting\webcharts.bat)
- The custom style is in the style tab of the webcharts GUI.
- Save this xml in a file to your web root/ directory where you have the cfm to create the graph. (e.g. you save the file by name "myStyle.xml" in wwwroot\charts directory.
- Use the "style" attribute to import these settings in the <cfchart> tag. e.g. you have cfm in wwwroot folder then you can say –
<cfchart style="charts\myStyle.xml" .... other attributes>